Following the launch of Calculated Benchmarks, an exciting new feature in Pave’s Market Data product, we’re taking a fresh look at equity compensation benchmarks across our dataset.
In case you missed the launch of Calculated Benchmarks, it’s a machine learning algorithm applied to our real-time equity grant database to give customers access to more relevant, timely, and accurate information.
To illustrate what we’ve been up to, we completed a new analysis of equity benchmarks for software engineers, including new hire and ongoing (or refresh) grants. Importantly, our analysis also examines the total vs. annualized value of equity awards, which is yet another special feature of Pave’s platform linked to our ability to access line-by-line data from equity management systems. Let’s see what the data shows us!
{{mid-cta}}
Exploring Our Latest Benchmarks
In the charts below, we examine total vs. annualized gross intended equity award values for software engineers based in the San Francisco Bay Area at public companies in the US with a market capitalization of $5B+. This dataset includes ~4.7K new hires with new hire grants and ~8.1K tenured employees who received ongoing grants.
While it is commonplace for compensation professionals to benchmark equity using total equity award values, getting reliable benchmarks for annualized equity award values has proved elusive. In many cases, people simply divide total equity award values by four (4) to estimate annualized equity grant values.
However, as more companies adopt shorter vesting periods, this 4:1 ratio no longer paints an accurate picture. In this specific case, our dataset, by virtue of including all grants and their specific vesting schedules, indicates dividing total award values by ~3.3 is correct.
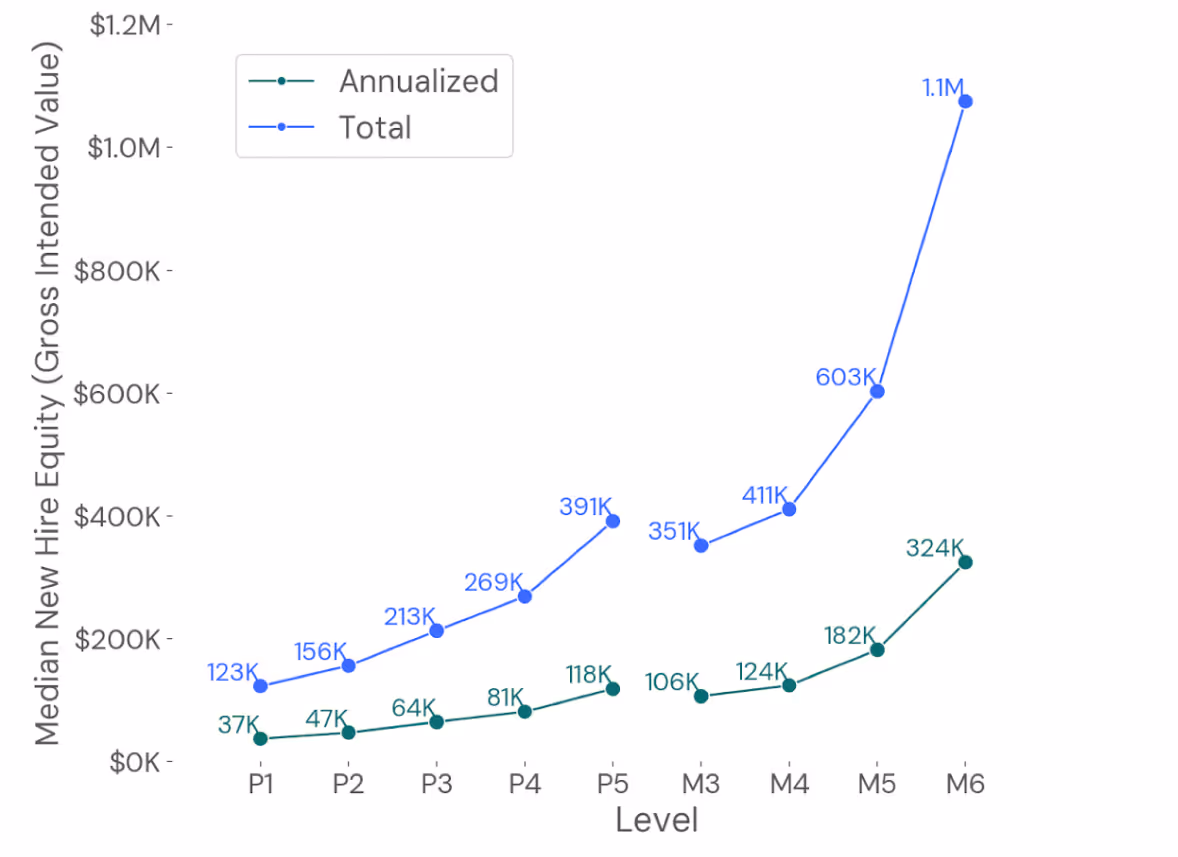
Total vs. Annualized New Hire Equity Grant Values for Software Engineers
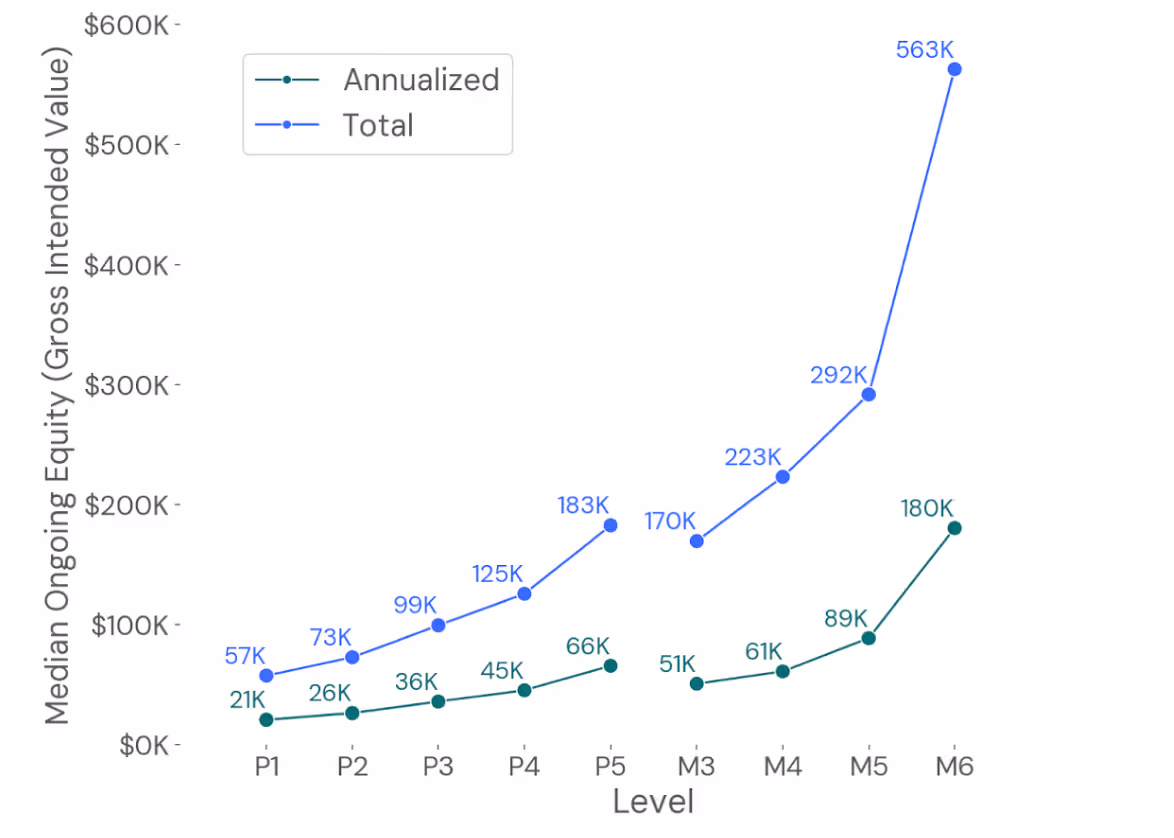
Total vs. Annualized Ongoing Equity Grant Values for Software Engineers
Fortunately, with Calculated Benchmarks and Pave’s ability to instantly toggle between total vs. annualized equity award benchmarks, there’s no extra guesswork required to understand the market. You can now conduct an analysis like the one above in seconds for any job anywhere in the US. Even better, Calculated Benchmarks outside the US will be launching soon.
Again, these results focus on software engineers based in the San Francisco Bay Area at public companies in the US with a market capitalization of $5B+. Equity award values vary significantly by location, company size, and company stage of development, so when using Calculated Benchmarks, we recommend applying additional filters to maximize accuracy and consistency.
To explore Calculated Benchmarks, sign up for Pave’s free Market Data product, or request a demo to access Premium Market Data features.

Pave is a world-class team committed to unlocking a labor market built on trust. Our mission is to build confidence in every compensation decision.