
Key Takeaways
- Marketing and Sales have the highest employee turnover rates at 24%, based on Pave data from 396K+ employees
- Engineering has the lowest turnover rate of any department at 17%
- GTM functions consistently lead on attrition, while R&D functions consistently trail
- Overall turnover rates are declining, but department-level variation makes averages misleading for compensation and retention planning
Average turnover rates tell compensation teams very little on their own. A company sitting at 20% overall could be losing engineers at 17% and sales reps at 24%, two very different retention problems with very different compensation implications.
Department-level employee turnover data is what makes the number actionable. It tells HR and compensation leaders where attrition is concentrated, which teams are most exposed, and where pay programs may need recalibration before the gaps become visible in headcount.
Employee Turnover Rates by Department: The Data
The chart below shows turnover rates across 14 job functions, based on real-time compensation from 396K+ employees in Pave’s dataset. Turnover includes both voluntary and involuntary departures over the last 12 months. Pave's dataset skews toward the technology sector, which tends to have higher attrition rates than other industries.
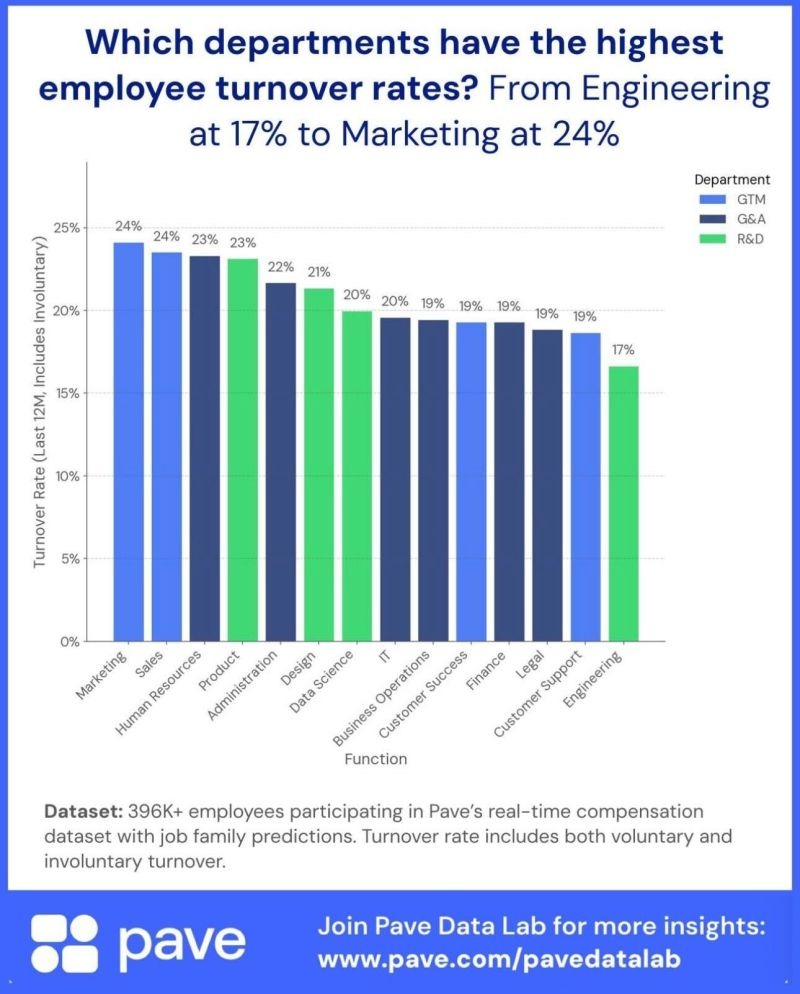
Bottom line: Marketing and Sales lead at 24%. Engineering sits lowest at 17%. The seven-point spread between the highest and lowest functions means a blanket retention strategy will miss the mark for most teams.
Marketing & Sales Teams Average 24% Annual Turnover
GTM sits at the top of the attrition table. Sales compensation is heavily tied to variable pay, quota attainment, and territory performance. When those targets miss or when a competitor offers a higher OTE, exit rates climb. Marketing faces a similar dynamic: headcount is often the first cut in a downturn, and the function has absorbed significant disruption from AI-driven workforce changes.
A 24% turnover rate means roughly one in four GTM employees churns annually. That carries a direct cost in recruiting, onboarding, and lost productivity that compensation planning needs to account for.
HR & Product Teams Average 23% Annual Turnover
Human Resources and Product both land at 23%. HR attrition is notable given that the function owns a retention strategy for the rest of the organization. Product sits high partly because the role scope varies significantly across companies, creating more lateral movement than functions with a tighter definition.
Engineering Teams Average 17% Annual Turnover
Engineering has the lowest turnover of any function at 17%. This aligns with Pave's Great Stay research, which found that engineering, information technology, and legal showed the lowest turnover rates in 2024 and 2025, and that fear of AI displacement is contributing to job-hugging behavior in technical roles.
The gap between Engineering at 17% and Sales at 24% is significant. Companies that apply uniform retention incentives across both functions are over-investing in one and under-investing in the other.
What the Department Split Says About Compensation Strategy
GTM roles are the most sensitive to variable compensation design. When bonus structures, commission plans, or equity grants fall out of alignment with the market, turnover responds quickly. R&D roles show the most stability, partly because of technical switching costs and partly because of current labor market conditions.
Compensation planning cycles that treat all departments the same will misprice retention risk in at least half the organization. Budget allocation, bonus targets, and equity refresh strategies should be calibrated by function, not applied uniformly.
Use Turnover Benchmarks to Get Ahead of Attrition
A 24% turnover rate in Marketing and Sales is a benchmark, not a surprise. The question is whether pay programs are calibrated to function-level risk or averaging across departments in ways that leave the highest-turnover functions underserved.
Pave's Market Data Pro gives compensation teams real-time data to benchmark pay by function, level, and location, so retention investments go where attrition risk is highest.

Pave is a world-class team committed to unlocking a labor market built on trust. Our mission is to build confidence in every compensation decision.

Frequently Asked Questions
What is the average employee turnover rate by department?
Based on Pave Data Lab's analysis of 396K+ employees, Marketing and Sales have the highest average turnover at 24%. Engineering has the lowest at 17%. Most G&A functions cluster between 19% and 23%.
What is considered a high employee turnover rate?
In tech, Pave's data puts the range between 17% and 24% by function. GTM functions at or above 24% are at the high end. Engineering teams above 20% are likely experiencing above-market attrition. The more useful benchmark is a comparison against the relevant function, not an absolute threshold.
What is the difference between employee turnover rate and retention rate?
Turnover rate is the percentage of employees who leave in a given period. Retention rate is the percentage of employees who stayed. For compensation benchmarking, turnover rate is the standard external reference. For executive reporting, the retention rate frames workforce stability more positively.
How do you calculate employee turnover rate?
Divide separations during a period by average headcount during that same period, then multiply by 100. Run the calculation within each function for department-level accuracy. Separate voluntary from involuntary turnover to identify whether compensation or performance management is driving exits.
How often should companies review employee turnover data?
A general best practice is to review quarterly at minimum, with immediate review when a department's rate moves more than three to five percentage points from baseline. Annual reviews are often too slow to catch attrition.