
Note: This article was originally published December 2, 2024. It has been updated to include current benchmarks as of September 2025.
I recently had a customer tell me they felt their go-to-market (GTM) team was beginning to feel “very top-heavy”. They were concerned there were too many VPs and Senior Directors in place.
What are the org chart benchmarks for senior leadership roles on GTM teams? And what about other departments, like R&D or G&A? Are certain functions more hierarchical than others?
Let’s explore Pave’s dataset to understand more. As it turns out, whether an organization is top-heavy depends on the function and stage.
Org Chart Benchmarks
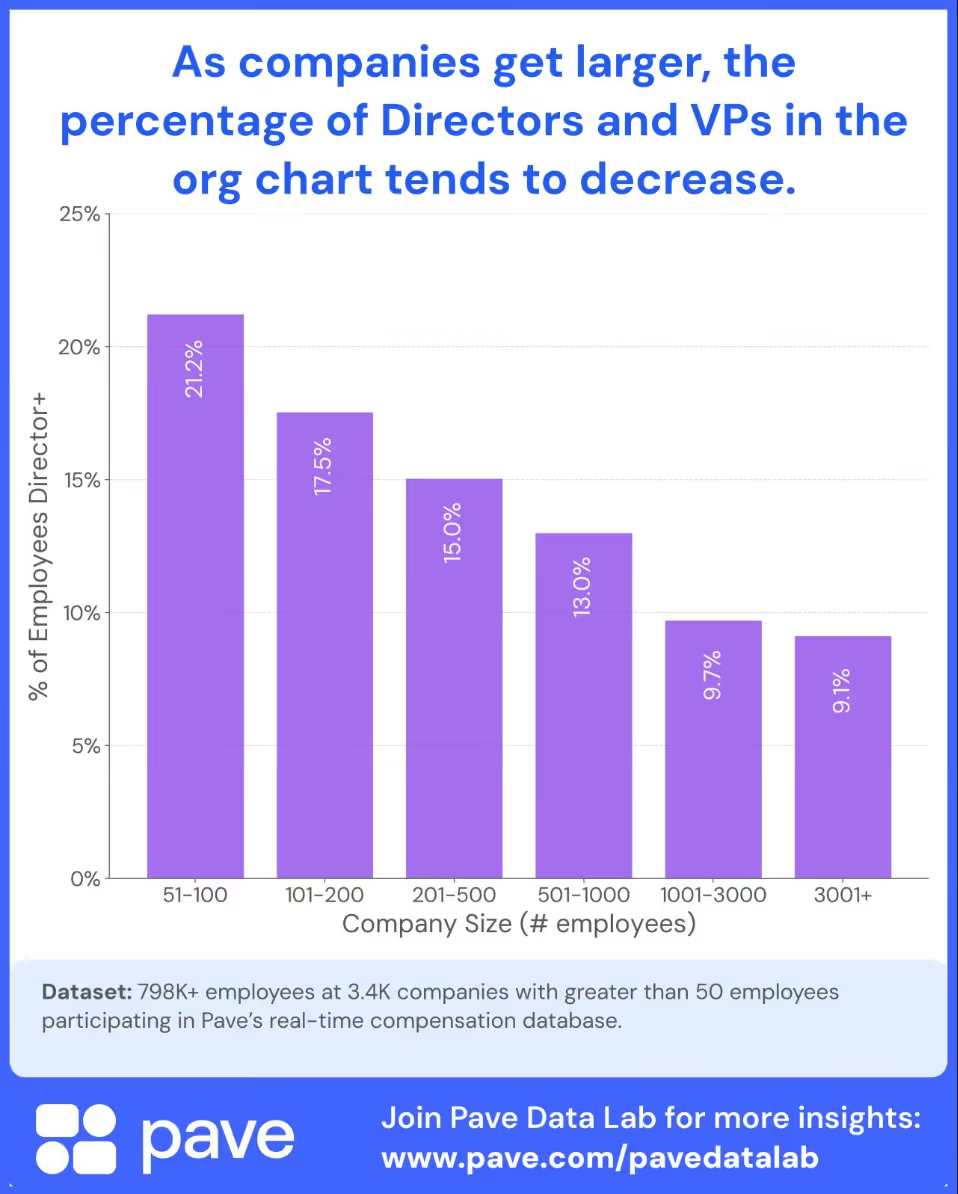
We analyzed ~3,400 companies with 50 or more employees in Pave’s dataset, looking at the average percentage of employees who are Director-level and above as a proxy for how top-heavy an organization is.
The trend is clear: As companies get larger, the percentage of Directors and VPs in the org chart tends to decrease. This is likely due to economies of scale in management as the org chart "fills in", and companies become more efficient at leveraging managers across bigger teams and more structured organizations.
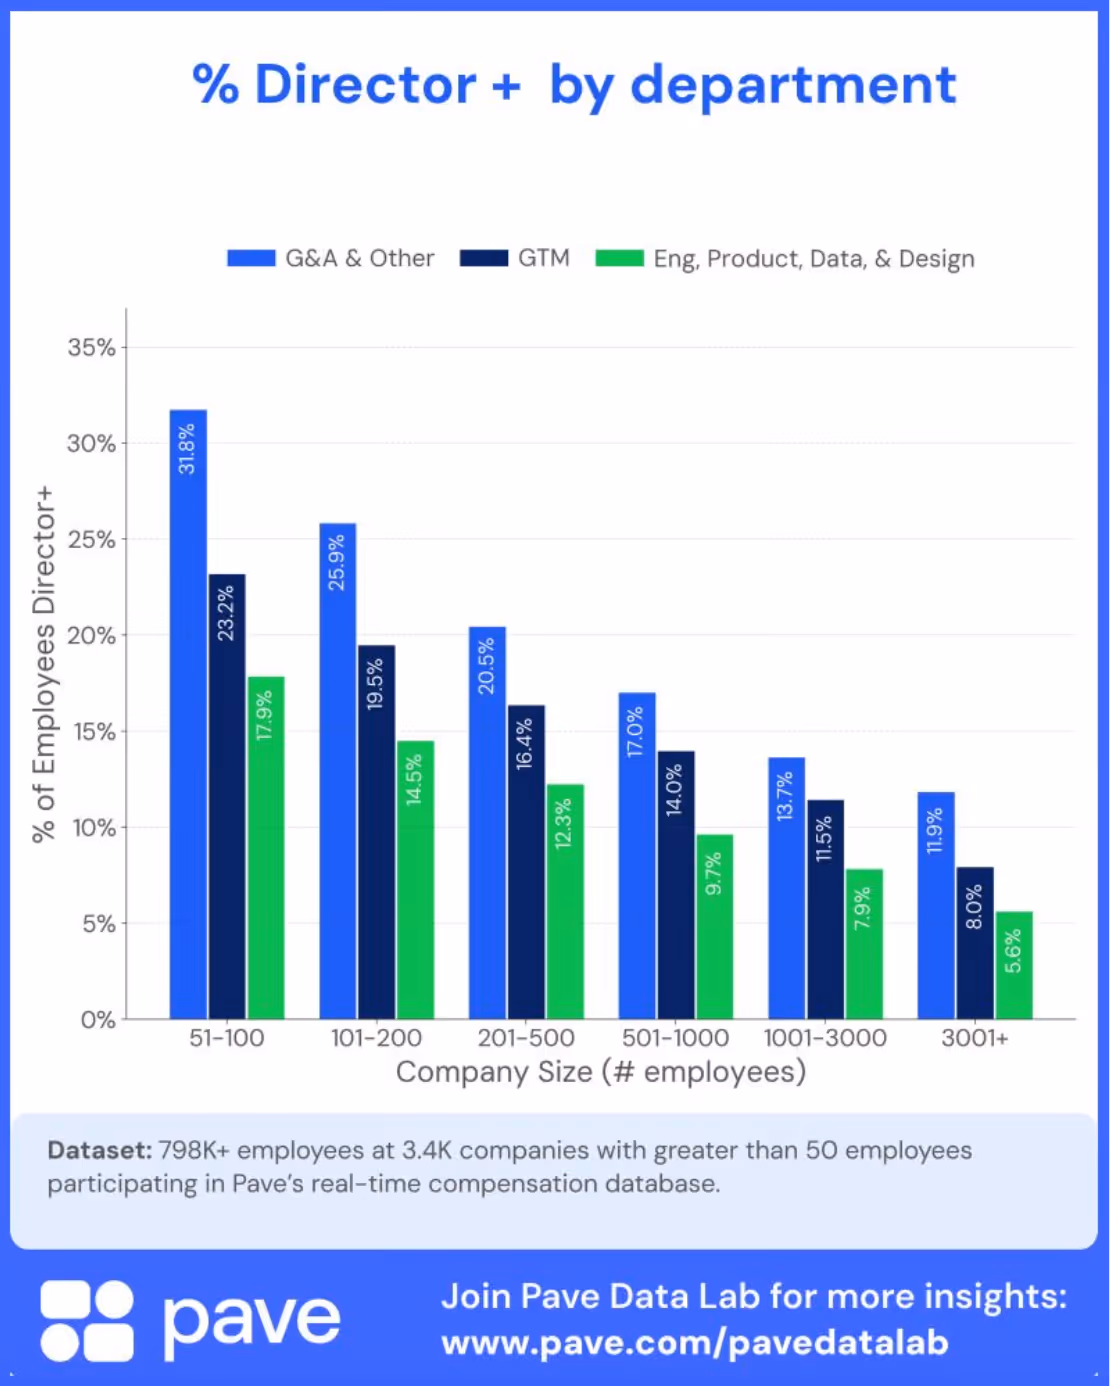
To go a level deeper, we also looked at the data by function. G&A orgs tend to be the most top-heavy, followed closely by GTM, while R&D orgs tend to be the least top-heavy.
{{mid-cta}}
Is your org chart top-heavy?
How does your company stack up? If your org chart feels top-heavy compared to these benchmarks, it’s possible that:
- You May be Over-leveling Your Senior Leaders
Are your “Directors”, “Heads of”, and “VPs” actually performing at their requisite levels? It might be worth reexamining your job levels.
- Your Org Chart May be Too Hierarchical
The latest org chart design mantra is “Flatter is faster, leaner is better.” Are there opportunities to streamline layers at your company and/or within your top-heavy functions?
Make sure to review span of control benchmarks (i.e. number of direct reports) as an additional method to evaluate the health of your org chart. A Pave analysis found that the average span of control benchmarks range from an average of 4.1 direct reports per C-level executive to 5.4 per M3 manager.
.avif)
Matt Schulman is CEO and founder of Pave, the complete platform for Total Rewards professionals. Prior to Pave, he was a software engineer at Facebook focusing on user-centric mobile experiences. A self-proclaimed "comp nerd," Matt is known for sharing data-driven thought leadership around all things compensation and personal finance.