
Every compensation professional knows this moment all too well: your annual market pricing and compensation planning exercise has reached crunch time and you just need a few remaining pieces of data to complete the puzzle. However, despite a robust compensation benchmarking process, your search returns "insufficient data"—or you get messy results skewed by a handful of companies in your sample.
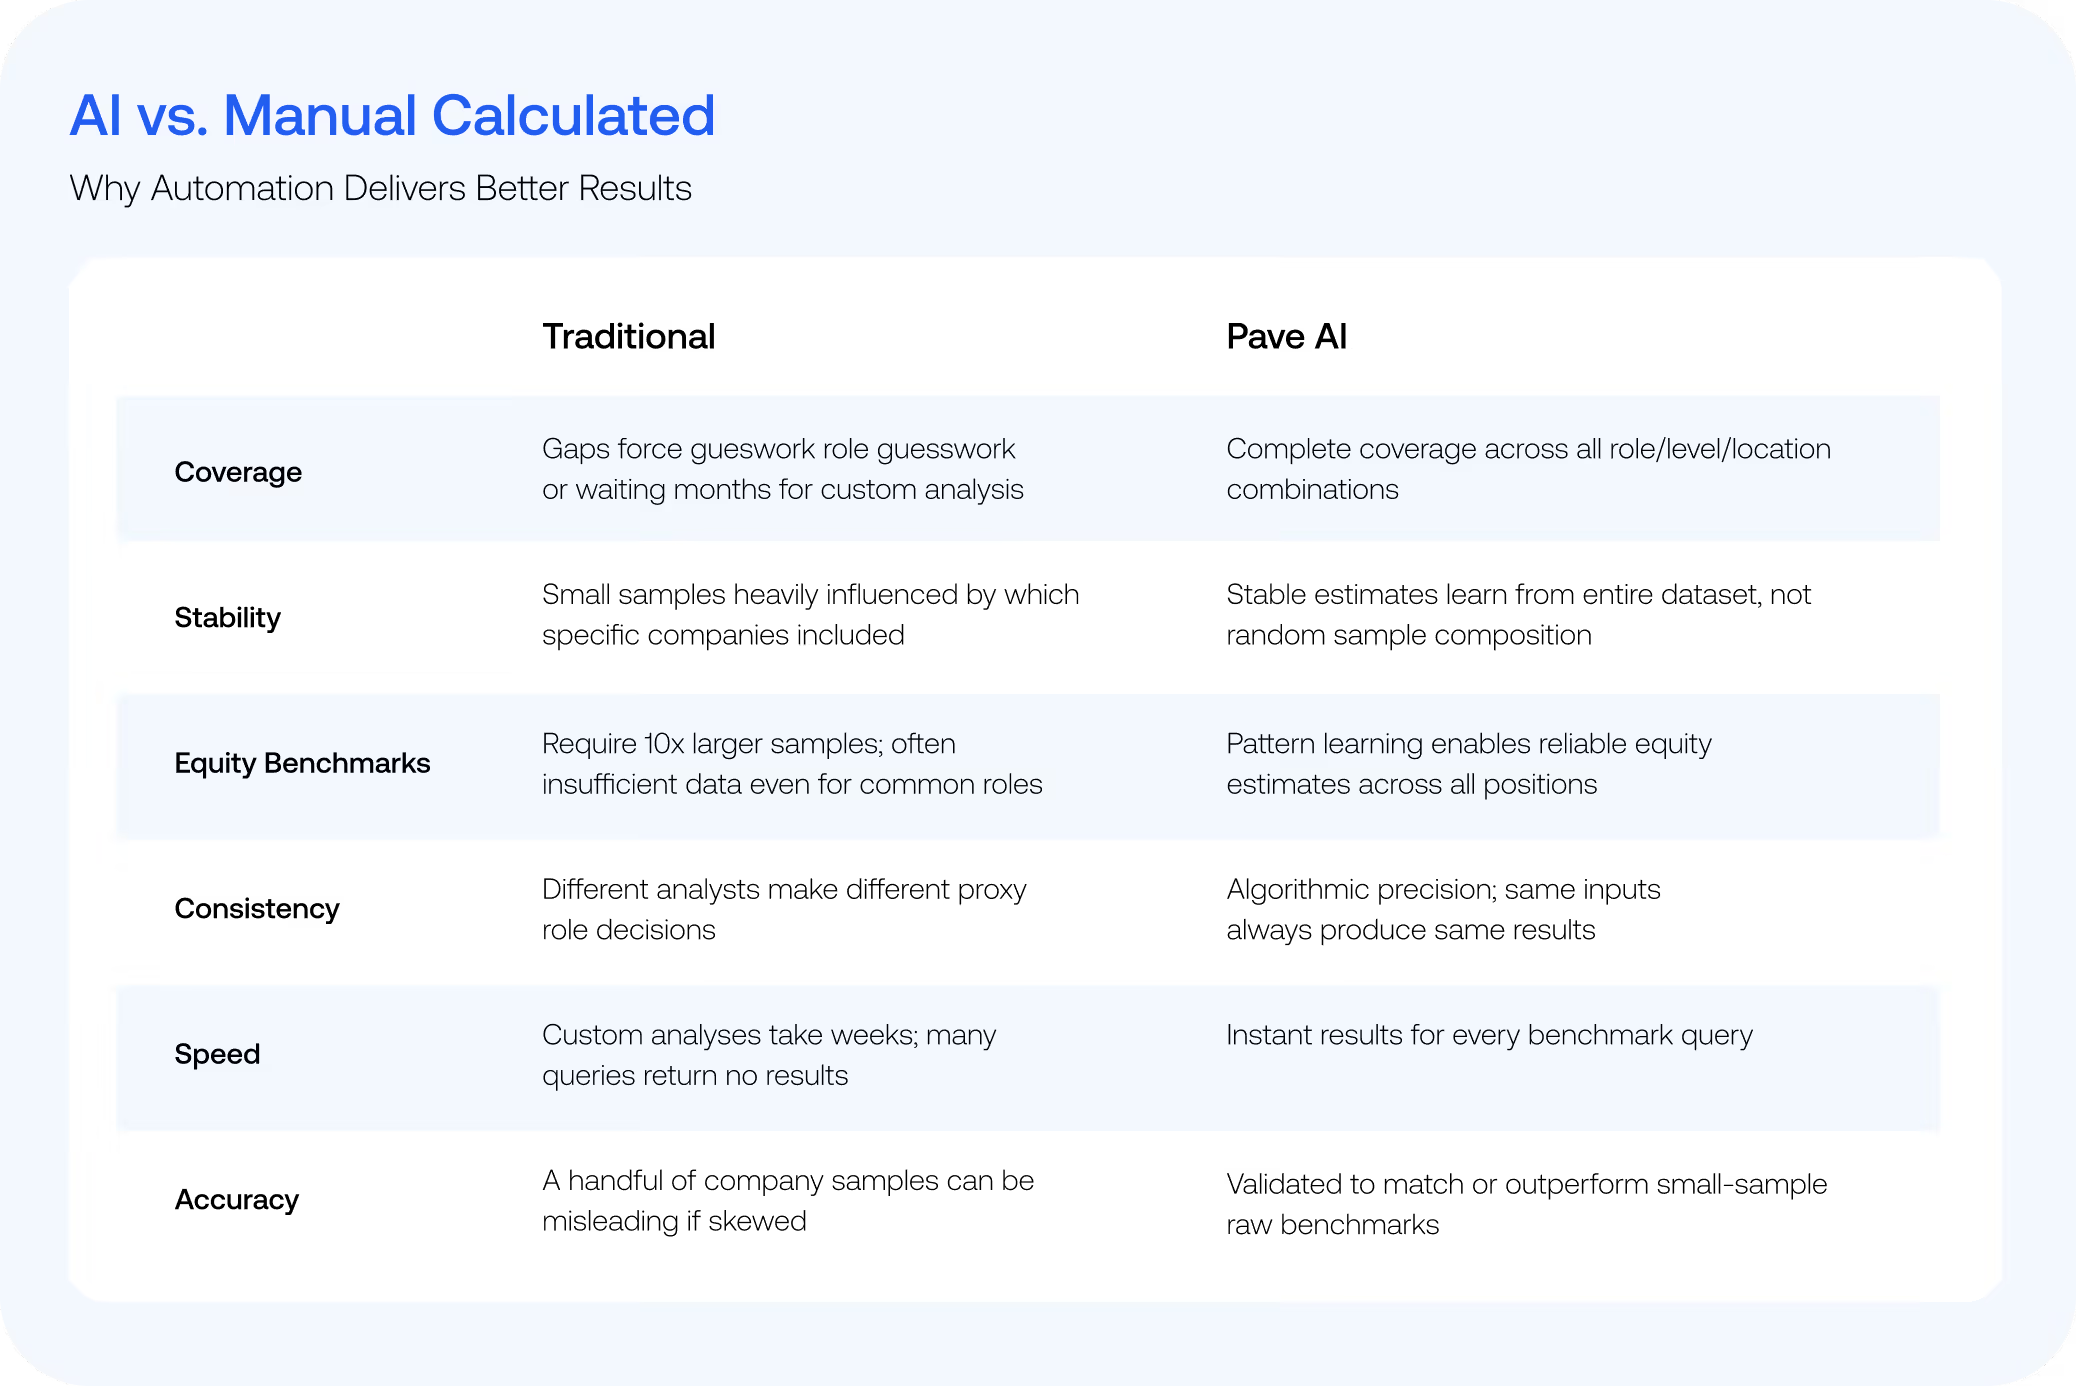
Here’s the problem: compensation survey data, even high-quality data, has inherent gaps. Emerging roles move faster than survey collection cycles. Specific levels, job families, and geographies haven't reached critical mass. These gaps force difficult choices: use a proxy role and make an educated guess at the adjustment, wait months for a custom analysis, or make a strategic recommendation with less targeted data.
This is where Calculated Benchmarks come in. You already smooth, adjust, and pattern-match compensation data when working with sparse information—mentally modeling how geography affects pay, how levels relate, and how similar roles compare to fill gaps. Calculated Benchmarks makes this pattern-learning explicit, applying machine learning across Pave's entire dataset to deliver the same insights at scale, with consistency that surveys and manual approaches can't match.
The Completeness Problem in Compensation Data
The challenge with compensation survey data isn't just staleness—it's coverage. Even comprehensive surveys can't capture every variation of role, level, location, and company stage that modern compensation teams need.
Consider benchmarking pay for a Senior Product Manager in Austin, TX at a Series B software company. If you add revenue, headcount, and capital raised filters to this query, you’ve created a data cut so precise and targeted, no survey can possibly produce benchmark data for you with a high degree of statistical confidence. There simply are not enough people working in the job family you’re benchmarking, in the location you need, working at companies just like you, and there never will be.
Sample size limitations hit hardest for senior roles, specialized positions, and above-market pay targets (75th percentile and above). And equity benchmarks compound the problem due to wide variation in programs and grant values. Equity benchmarks require roughly 10x the sample size as base salary to achieve the same statistical reliability. Emerging roles (AI/ML Engineers, Forward-Deployed Engineers) and geographic expansion into new talent markets create additional gaps before surveys can catch up.
The current workaround—relying on consultants and compensation professionals to mentally model these patterns—is time-intensive, inconsistent across team members, and challenging to scale. Getting around this problem requires an entirely new way of thinking about compensation data.
Why Pattern Learning Beats Exact Matching
Many assume raw benchmarks provide "ground truth" while calculated benchmarks are approximations. In fact, both are estimates with different trade-offs.
A raw 75th percentile benchmark based on 30 companies can be misleading. If 20 are high-paying tech giants, you're seeing those companies' compensation philosophies, not market rate. That's the hidden problem with small samples: which companies are included heavily influences the outcome.
Calculated Benchmarks address this by learning patterns separately—by role, level, location, and stage—rather than letting sample composition randomly influence results. The model recognizes that a "Senior Engineer in Austin" shares systematic patterns with a "Senior Engineer in Denver" and a "Staff Engineer in Austin." By learning these relationships, we provide stable estimates across all combinations, including ones that will never have 50+ exact matches.
How Calculated Benchmarks Work
Compensation data exhibits strong, predictable patterns. US roles pay more than equivalent UK positions. Higher levels earn more than lower ones. Series C companies differ from Series A startups. San Francisco commands different rates from Oklahoma City.
Pave's machine learning models identify and quantify these patterns, enabling informed decisions even when exact data is missing. The algorithm combines knowledge of market compensation trends, raw data for your chosen benchmark, and machine learning to deliver estimates when robust data isn't available for that specific combination.
For many, this is automated regression analysis—similar to manual processes but at scale and with consistency beyond traditional approaches.
Validation: Where Calculated Benchmarks Meet Raw Data
Our models are rigorously validated against market data and reviewed by industry experts at multiple compensation consulting firms.
We continuously test Calculated Benchmarks against held-out raw data across thousands of role, level, and location combinations. In testing, Calculated Benchmarks match or outperform small-sample raw benchmarks in stability and reliability—and provide robust estimates in thousands of cases where raw data is too sparse to use.
When you search in Pave, the platform seamlessly integrates raw and calculated benchmarks, clearly labeled so that you can use these insights directly in your workflow.
Understanding Consistency Labels
Regardless of sample size, understanding market variation is critical. Two benchmarks with the same sample size can have significantly different consistency labels—one with tightly clustered compensation, another with wide pay variation.
When you see "Low Consistency," it indicates variation in how companies pay for that role, reflecting market dynamics rather than data quality. Use it as a reference point while recognizing variability. Leverage your organization's compensation philosophy, pay ranges, and talent strategy to guide interpretation.
What Compensation Teams Need to Know
Calculated Benchmarks speed up complex workflows and guide your next steps when data gaps would slow you down. But compensation expertise still matters—these tools support decision-making, they don't replace judgment.
Your organization's unique structure and philosophy matter. If you use eight individual contributor (IC) levels instead of Pave's P1-P6 framework, you still need to map the data. If your philosophy calls for above-market pay for strategic reasons, you'll make that adjustment. Calculated Benchmarks provide market intelligence; your expertise guides final decisions.
When to lean into Calculated Benchmarks:
- Filling gaps where raw data is sparse or unavailable
- Benchmarking emerging or niche roles
- Expanding into new geographies with limited survey coverage
- Building complex compensation structures with partial data
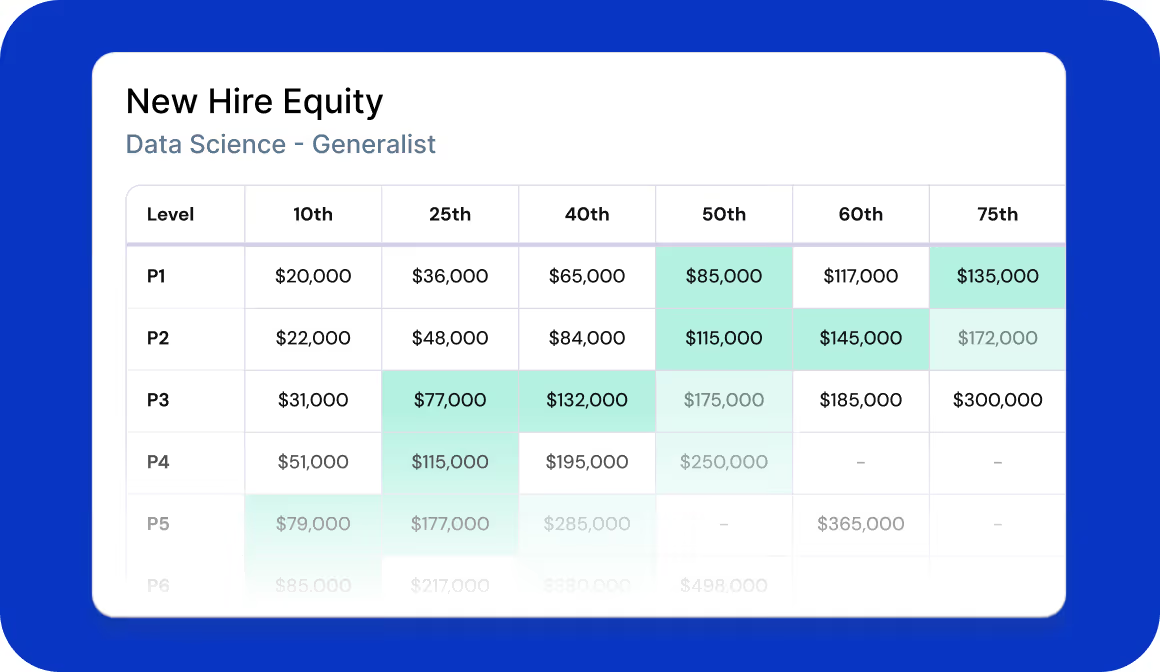
- Designing equity programs where sample size requirements create common gaps
When to apply additional scrutiny:
- Highly critical or visible roles requiring multiple sources
- Executive compensation with board-level scrutiny
- Roles marked "low consistency," indicating high market variability
Low consistency doesn't mean low quality—it means the market varies widely. Calculated Benchmarks still provide valuable reference points, but consider them one input among several.
Bridging Data Gaps with Compensation Intelligence
Every hour your team spends debating proxy calculations is an hour not spent on strategic planning. Calculated Benchmarks change that equation — delivering the precision and accuracy of careful manual analysis, powered by millions of underlying data points, without sacrificing the time your team needs for strategic work.
Think about the next time a business leader asks why a critical role has no market data. Do you want to explain the gap or show them a number you trust? Calculated Benchmarks turn compensation data from a patchwork of coverage into a complete, decision-ready dataset — so you can answer with confidence every time.
Ready to close the gaps in your compensation data? Book a demo of Market Data Pro today.

Charles is a member of Pave's marketing team, bringing nearly 20 years of experience in HR strategy and technology. Prior to Pave, he advised CHROs and other HR leaders at CEB (now Gartner's HR Practice), supported benefits research initiatives at Scoop Technologies, and, most recently, led SoFi's employee benefits business, SoFi at Work. A passionate advocate for talent innovation, Charles is known for championing data-driven HR solutions.

Calculated Benchmarks FAQs
What are Calculated Benchmarks in compensation?
Calculated Benchmarks use machine learning to systematically learn from and fill gaps in compensation data by identifying patterns across comprehensive datasets. When raw survey data is insufficient for specific roles, levels, or locations, Calculated Benchmarks provide reliable market intelligence by analyzing relationships between job families, seniority levels, geographies, and company stages.
Why is there insufficient data for some compensation benchmarks?
Compensation data gaps occur due to sample size limitations (especially for senior or specialized roles), emerging job families that evolve faster than survey cycles, geographic expansion into new markets, and equity data that require 10x as many data points as base salary for statistical reliability. Additionally, Pave applies strict reliability thresholds—including consistency and sample size requirements—before displaying any benchmarks. While this happens much less frequently than traditional approaches, if a benchmark does not meet these thresholds, it will not be shown to ensure that only robust, reliable market data is presented. While Pave’s calculated benchmarks leverage data more efficiently than other providers, these safeguards remain in place to maintain data quality and trust.
How do Calculated Benchmarks differ from traditional compensation surveys?
Traditional surveys provide raw data points from participant submissions (typically annually), which Calculated Benchmarks enhances by using machine learning to analyze real-time patterns across the entire dataset. Both rely on similar foundational market data and are validated and reliable, but Calculated Benchmarks fill coverage gaps when raw data doesn't meet the data-point threshold for robust benchmarking and is accessing the underlying data in real-time.
What does "low consistency" mean for compensation benchmarks?
A low consistency label indicates high market variability in how companies compensate for that specific role, not low confidence in the benchmark calculation. It signals that pay ranges vary widely across the market, requiring compensation professionals to apply additional judgment and consider their organization's compensation philosophy.
When should compensation teams use Calculated Benchmarks?
Use Calculated Benchmarks when building compensation frameworks with sparse data, benchmarking emerging or niche roles, expanding into new geographies, designing equity programs, or when traditional surveys return "insufficient data." They're particularly valuable for roles moving faster than survey collection cycles and for most day-to-day compensation decisions where pattern-learning provides more reliable estimates than small raw samples.
Are Calculated Benchmarks meant to replace compensation expertise?
No. Calculated Benchmarks provide market intelligence foundations, but compensation professionals must still apply organizational context, map internal level structures, interpret consistency labels, and align recommendations with company compensation philosophy and talent strategy.
How accurate are machine learning-based compensation benchmarks?
Calculated Benchmarks are rigorously validated against market data and reviewed by compensation consulting firms to ensure industry-aligned results. They automate the same normalization and smoothing processes compensation professionals use manually, but with greater scale and consistency. In testing against held-out raw data, they match or outperform small-sample raw benchmarks in stability and reliability, while systematizing the same pattern-recognition that compensation professionals apply manually.
What's the difference between raw and calculated compensation data?
Raw benchmarks are data points sourced directly from market surveys, while calculated benchmarks are derived by analyzing patterns across the broader dataset. Both types are clearly labeled in compensation platforms and serve complementary purposes in building complete market intelligence.
Why do equity benchmarks and senior roles need Calculated Benchmarks more than base salary or other roles?
Two reasons: First, equity values vary much more widely than base salary, so you need more data points to see a clear pattern.
Second, when you're benchmarking at higher pay levels—like the 75th percentile that many companies often target for competitive roles—you're working with a much smaller slice of your data. A benchmark of 30 companies at the 75th percentile really means you're looking at just the top 7-8 payers. If those few companies happen to be unusually generous (or conservative), your benchmark gets distorted.
Calculated Benchmarks pool information from thousands of similar roles to give you stable estimates at any percentile, which is especially valuable for equity grants, senior roles, and other high-stakes compensation decisions.
Why would a Calculated Benchmark be more reliable than raw data?
Small raw samples can be heavily influenced by which companies are included. A benchmark of "30 companies" might be 20 tech giants and 10 startups, skewing results. Calculated Benchmarks learn company-level, geography, and role patterns separately, then combines them systematically. This approach provides more stable estimates, especially for tail percentiles (75th percentile and above), where small samples are particularly unreliable.